![]()
Binary Option Reversal Strategy – Common Yet Effective

Binary Option Reversal Strategy – Common Yet Effective
Submitted by adil on Thu, 02/05/2015 - 14:19
Tagged as: Binary Options Trading , Binary OptionsReversal strategy is widely used strategy by binary options traders, and most of the new entrants experiment with this strategy when they begin binary options trading, because this strategy is very easy to use and is based on common sense. This strategy is used when a trader observes the asset price action to determine its expected reversal. The reversal occurs when the price of an asset starts moving in the opposite direction.
How to Use Reversal Strategy in Binary Options Trading
For example, a trader implements a reversal strategy by trading the PUT options when the asset price continues to move in an upward direction, and reaches a maximum point as compared to past prices, and uses the CALL options when the price of an asset continue to fall, and reaches the minimum point in relation to past asset price. It is usually done by visually comparing the latest price actions with the previous price points in different time periods. But, you can also use other advance tools to monitor the expected reversals and to highlight the entry levels.
Using Technical Indicators in Reversal Strategy
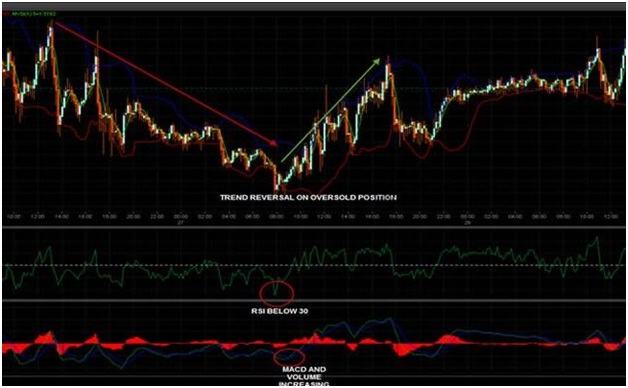
In the figure above, a trader is tracking the movement of GBP/USD during an extended downward trend. Reversal took place at different levels, but it was for a very short period of time after which GBP/USD currency pair continued to move downward. If the trader was monitoring an asset price visually, he could get tempted to enter multiple call options trades, which would certainly close out of the money. But he did not. Instead, he used technical indicators of two different types, called Relative Strength Index (RSI) and Moving Average Convergence Divergence (MACD), to confirm his instincts, and to provide signals at a probable reversal point. Let’s look at these indicators briefly to understand how they work in relation to reversal strategy.
RSI – It is a momentum indicator that is used to compare the latest profits and losses to figure out whether an asset is over-sold or over-bought. If the Relative Strength Index is lower than 30, the underlying asset is considered to be oversold, but when it is more than 70, the underlying asset is said to be over-bought.
MACD – On the other hand, the latest price action is used by a trader under this indicator in order to compute the difference between an underlying asset’s 12 day and 26 day exponential moving averages. MACD marks these price actions on a same chart, and use 9 day moving average of an asset to provide trading signals. Therefore, when MACD moves higher than a 9 day moving average, it is considered as a reasonable time for traders to buy, and when it moves lower than a 9 day average, it is a good time for trader to sell.
In the above image, you can clearly see that the price of an underlying asset is moving to a minimum point right when RSI moves lower than 30, and shortly after, signals are confirmed by MACD when it crosses the 9 day moving average. When the RSI is confirmed by MACD, traders usually buy Call options, because the trade will close in the money regardless of what the expiry period will be.
However, when you apply this strategy, it is important to know that reversals are usually established when you are monitoring trades with short term expiry. Therefore, for longer term trades, you must consider support and resistance level so as to secure profitable trades.
Register For...
Free Trade Alerts
Education
1-on-1 Support
eToro Copytrader Tips