![]()
Understanding the Overlapping Fibonacci in Forex Trading
Understanding the Overlapping Fibonacci in Forex Trading
Submitted by adil on Wed, 09/03/2014 - 19:45
Tagged as: Forex Trading , Forex Trading
Overlapping Fibonacci in Forex Trading
The Overlapping Fibonacci is usually the next step for traders after they have already used the Fibonacci retracement signals in forex trading many times. In this strategy, traders use the confluence of Fibonacci extensions or retracements with other indicators, such as, pivot points, and resistance or support level etc.
The idea of using overlapping Fibonacci strategy is quite exhilarating because this is exactly what you need in forex trading. In this strategy, a trader gets to trade two strong Fibonacci points at a known resistance and support region, and will probably get a usable reaction from it. Traders find it very simple to use and therefore, they prefer to use it instead of any other trading strategy.
In order to understand it more clearly, let’s take an example of a chart that will be explaining the overlapping Fibonacci patterns in detail. A trader can use any chart that shows a reasonable highs and lows of prices in combination with other moderate level retracements that appear throughout the way and form Fibonacci signals on the chart.
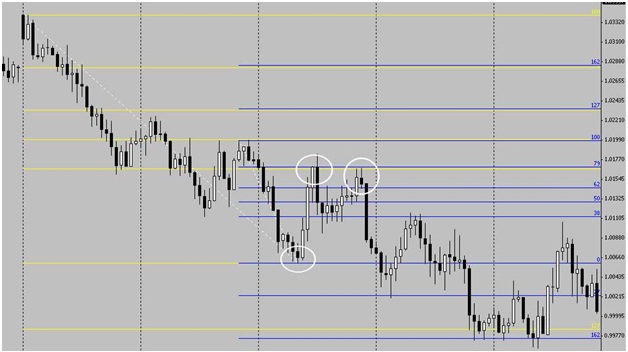
If you look at the chart above, you can see two formations of Fibonacci in a strong bearish trend. The yellow Fibonacci lines were formed as an outcome of the highs shown on the left of the chart toward the lows as shown by the first circle. Whereas, the blue lines appeared as a result of fibs formation from a lower swing high (which also happened to form a double top as shown in the chart above) to the same lows as that of the yellow lines.
Two entries can already can be seen at the confluence of yellow lines at a Fibonacci retracement level of 38 percent in combination with the blue ones at 79 percent.
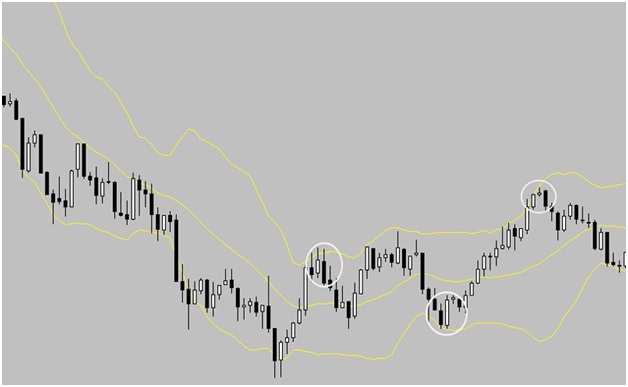
The above image indicates the similar position in a bullish trend. If you look at the encircled signals, they show a probable chance of entry with the upward engulfing candle signals at the confluence of 79 percent Fibonacci retracement level and at 38 percent Fibonacci retracement level. It is very important for a trader, who prefer to use the Fibonacci Retracements, to understand that confluence can be found in any of the Fibonacci Retracement levels, whether it be at 38 percent, 50 percent, 62 percent or 79 percent.
Another benefit of using this strategy is that traders can choose the trades on the basis of confluence that takes place at different Fibonacci retracements or extension points (such as, 38%, 62% or 79% etc.) and the process of finding and achieving this confluence is exactly the same. It can be done by forming Fibonacci retracement lines on the chart and then find the levels that are overlapping. Note that the extension or retracement levels of the Fibonacci lines will be enabled.
Mostly, the experienced traders always trade it in confluence with the other patterns and events that are available during that period. Some of the strongest supporting patterns are, Fibonacci level, Trends, Pivot points, Resistance or Support levels, round numbers, and Candlestick patterns.
Register For...
Free Trade Alerts
Education
1-on-1 Support
eToro Copytrader Tips