![]()
Understanding Breakout Strategy with Drop and Stop Trade
Understanding Breakout Strategy with Drop and Stop Trade
Submitted by adil on Fri, 09/05/2014 - 17:30
Tagged as: Forex Trading , Forex Trading
Stop, Drop and Trade!
This strategy is somewhat similar to the Pop and Stop trading strategy, because a lot of principles associated with this strategy are the same as used in Pop and Stop trading.
If you look at the chart, you can see a channel breakout trading pattern, which is favorable when the market opens. At the right side of the chart, a price moving in an upward direction can be seen over a narrow range on the left side. Although, it was not possible to have the entries at this point using the pop and stop strategy, yet, an evening star candlestick pattern was created by the price at the weekly pivot point (shown as blue line). Based on other confluences, you can enter a short trade once the first long candle is down.
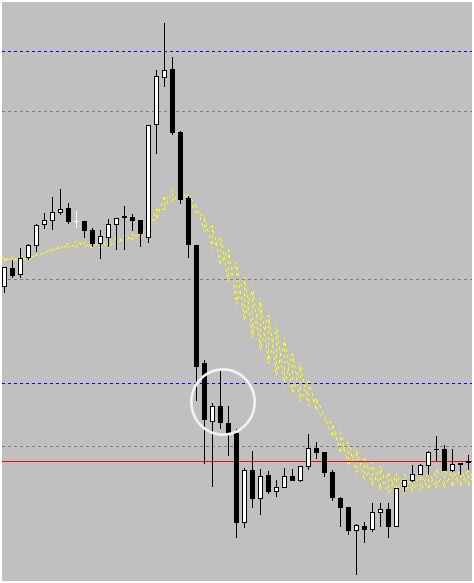
After the confirmation of the bullish price breakout and retracement with another bearish breakout, it settled underneath the weekly pivot point, as shown by the circle. Initially, number of rejections were formed from a round number as represented by the grey line before the final confirmation that there is movement with the downward trending rejection bar candlesticks below the weekly pivot point.
It doesn’t represent the ideal trading position, since the majority of the traders would be worn out due to the upward price movement followed by a sharp decline. Most of the average daily range is supposed to be consumed at this point. Another issue of round numbers with any short trade can also arise.
If you look at the chart, you can see how the price breaks underneath the round number and then moved back followed by a rejection to the lower side. Price continued its bearish move, but this would probably end in breakeven or a ratio of 1.5 to 1, which is a win.
The second chart represents that the price fails at a polarity indicator as shown at the top-left of the chart and then bursting into downward trending candles from the range that continued to move to the left side of the chart. At this point, Drop and Stop was formed as highlighted by the first circle. However, no confirmation was received from the downward trending bar for a trade entry. The second circle also shows the other drop and stop pattern, and yet again, it was not a convincing downward trending rejection candlestick, which could ensure the move. The downward trending candle on the right side of the highlighted encircled area shows a bit risky rejection bar candlestick entry.
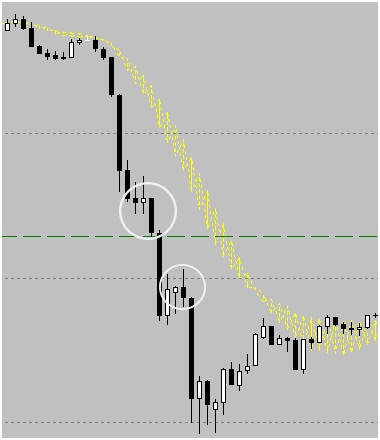
Any of these entries would have eventually been successful. The move was almost was completely used up at the round number as shown at the end of the chart, producing a number of rejections. The final confirmation of the reverse movement was an upward trending rejection bar candle from the round number. When the next candle came to a close over the range of the final Drop and Stop section, it provided an indication that the price was going to move back in an upward direction. So, when the price moved back, it closes over the polarity indicator (yellow area).
Register For...
Free Trade Alerts
Education
1-on-1 Support
eToro Copytrader Tips