![]()
Trading the Forex Dual Stochastic Signals
Trading the Forex Dual Stochastic Signals
Submitted by adil on Wed, 09/03/2014 - 19:00
Tagged as: Forex Trading , Forex Trading
What's a Dual Stochastic Signal?
In a forex dual stochastic trade, slow and fast stochastic signals are combined with one another and then traders look for the right time when the signals reach the opposite extremes. The points at 80 percent and 20 percent are usually considered to be the extreme levels. Another measure used for this strategy is the 20 EMA.
In the following examples, you can see the combination of fast and slow Stochastics in one window at the end of the chart. It is very easy to use this strategy and in order to use it correctly, you should start by placing one of the two stochastic signals on the chart and then move the next signal from the navigator window and put it right above the first stochastic signal.
There are certain rules that a forex trader should remember while using this strategy, and these rules are as follows:
- He should wait till the price reaches the point where it shows strong trending.
- Make sure that Stochastic signals are at opposite extremes
- In order to confirm the entry, find a suitable candle pattern that gives an indication of reversal after a brief retracement to the 20 EMA.
Instead of the 20 EMA, traders can also choose to apply mid-band of the Bollinger bands. Following is a chart with 60 minutes time frame, which is very suitable period to trade this pattern:
The encircled signals show the likely entry for a short in a bearish trend. Yellow bands are the slow Stochastic signals and blue bands shown at the bottom of the chart are fast Stochastic signals. As you can see, yellow bands indicate that they are exceedingly oversold and blue ones show that fast Stochastics have just slowed down after they have been massively overbought.
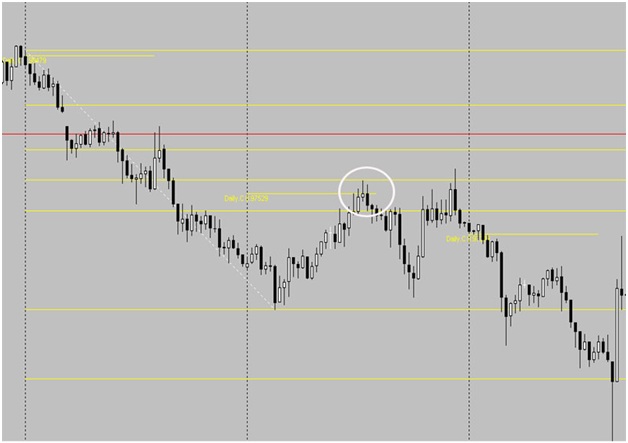
In the next example, you can see that slow Stochastic signals started rising from the oversold area. Moreover, the price also fell away after a double top. So, it shows that you, as a trader, should be ready to make a reasonable call at this point of time.
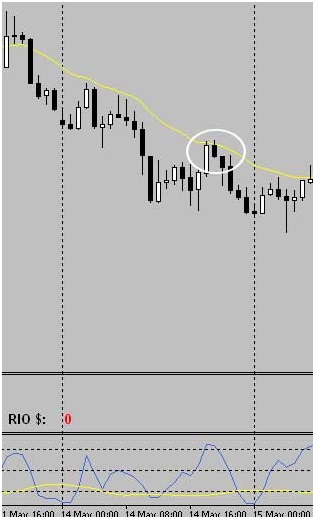
In the chart above, you can see a short entry in a confirmed bearish trend. It also reached the 20 EMA and got confirmed rejection. The downward trending candle does not show the classic engulfing pattern, but it can be validated by candles that form after the first one.
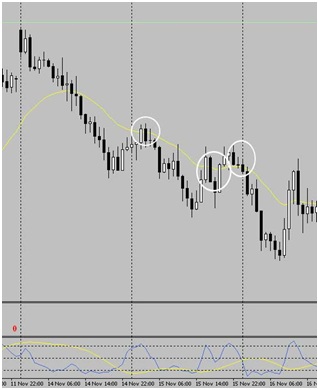
As you can see above that the first encircled entry is actually a WINNER as it shows a near classic entry, in which the price is declining and has fallen below the old support level. The second entry is showing the perfectly formed evening star at the 20 EMA. However, taking this second entry would probably result in loss or it will hit the breakeven. This indicates that the strategies we use are not always perfect. All of these trades have been taken from the past and no one knows what was happening in the market at the time, which may also have an effect on the market sentiments. There are many traders, who used these strategies and performed exceptionally well in the market. In order to get better results, it should be used in confluence with other events and indicators.
Register For...
Free Trade Alerts
Education
1-on-1 Support
eToro Copytrader Tips