![]()
The Daily Fibonacci Pivot Strategy
The Daily Fibonacci Pivot Strategy
Submitted by adil on Thu, 08/28/2014 - 20:00
Tagged as: Forex Trading , Forex Trading
Your Daily Fibonacci Pivot Strategy
This strategy is used to enter the trade by confluencing the daily pivot points and Fibonacci retracements. Some of the favorable parameters used by the traders are 38 percent or 50 percent Fibonacci points that are in confluence with the daily pivots. Like any other free forex trading strategy, this strategy can be interpreted in many different ways as there are many variations to it. However, experienced traders use the daily Fibonacci pivot strategy to increase the chances of opportunities that comes with relaxing the trade entry requirements in a following ways:
- Find a trade entry of a currency pair, which shows that the average true range of previous 5 days exceeds the trading sessions of the past few days.
- And draw fibs at the beginning of the current session, from the last few days low to high in case the price is currently more than the current central pivot point. Or, from high to low of the last few days if the current price is lower than the current central pivot level.
- Find a confluence of daily central pivot level and Fibonacci retracement points.
- Once the price is identified after retracing to the confluence, a trader enters the trade or wait for the confirmed candle signals in order to confluence before the entry. Although, entering the trade before a confirmed signal is very risky, yet, higher risk is associated with higher returns.
The following examples represent the trading entries at two different levels, such as, at 38 percent and 50 percent:If you look at the chart below, you can clearly see a long entry at the confluence of daily central pivot level and 38 percent Fibonacci retracement level.
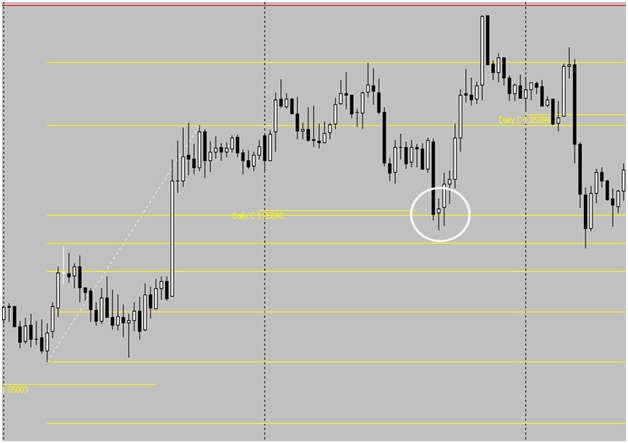
You can enter in two ways as these ways would provide a likely target at 127 percent Fibonacci extension point. You can either buy at the first touch of this level, or wait for morning-star-candle to appear.
Stop-loss for these trades is mostly behind the Fibonacci levels, usually just one level away and you can trade the trade from this point. So, it means that this will be equal to the 50 percent retracement point, with some extra pips that were for buffering.The following chart represents the reverse of the last trade. In this case, sell occurs at the confluence of the daily central pivot and 38 percent retracement.
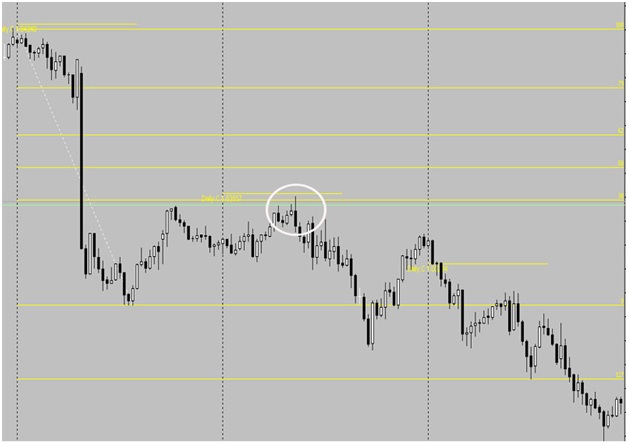
This was a better setup as compared to the big fall happened in the last trading chart. That drop was a representation of change in the market sentiment, which adds more weight to the decision to sell.Following is another example of sell after a long-run-down of the previous day:

This is a selling at a 50 percent retracement point. Although, it is not properly in confluence with the daily pivot, yet, you can see that an evening-star-candle was formed by the confluence of 50 percent Fibonacci retracement point and daily central pivot. It is important for a trader to remember that with every new strategy, he should perform back testing and live testing in a demo account prior to going into the actual market.
Register For...
Free Trade Alerts
Education
1-on-1 Support
eToro Copytrader Tips