![]()
Explaining the Forex Fractal for Binary Trading
Explaining the Forex Fractal for Binary Trading
Submitted by adil on Thu, 09/04/2014 - 11:23
Tagged as: Forex Trading , Forex Trading
Going Deeper into the Forex Fractal...
The Forex Fractal is related to the consolidation and channeling of price, which is observed by most of the traders in the forex market. In fact, the major market players keep a keen eye on channels’ boundaries. As a result, support/resistance levels appear on a trading chart.
In literal terms, Fractal means a geometric formation that recurs at a smaller level so that asymmetrical patterns and surfaces can be created, which cannot be shown by traditional geometry. It is just like Fibonacci patterns that can be seen in the arts, nature and even in trading. Many a times when a trader selects any pattern on a 5 minute forex chart, he can see the same pattern forming on higher time frames. Mostly, these trends or patterns lie within a same span of time on these higher frames of time.
So, how is a fractal different from a simple price channel? As you know, it is easy to find a single price channel on a trading chart, but as soon as you begin to pile up the fractals over one another, the price starts fractalling along a trajectory in an upward or downward direction. It is a very strong reference point as it shows what the trend is and how bullish the price will be after bursting out of a fractal and before dropping back into it. Let’s say, the average of fractals from the lower to the upper edge is 50 pips. Now, if the price goes in any direction, you know that it shall not cross 50 pips. This allows you to place stops and earn profits more reliably.
Another difference between a simple price channel and a fractal can be found through the understanding of basic features behind the formation of price fractals. It enables you to understand the market and its price dynamics more clearly. The basis of the fractal price actions is connected with the order flows of key players, such as, trading houses, banks and other big guns in the market.
In the following example, a bearish trend of the price has been discussed. Three fractals have been spotted on the chart as shown by the white lines in the figure below.
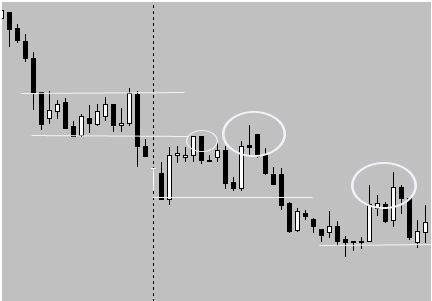
When the price jumped to the left side of the chart, it created holding formations and moved sideways. There can be different reasons for this to happen, but what usually happens is that seller steps out of the market and as a result, the price is settled.
The price slides toward the end of the session after the appearance of first fractal, as shown by the vertical lines. The traders who exit the market establish their positions and in this scenario, it ended up having long withdrawing and a decline in price.
A resistance appeared below the previous fractal. The old section of support shows a section where sellers are queued. When the price reach that section, it is rejected twice as shown by two circles in the center of the chart. Both these ‘rejections’ depict a likely short entry on the basis of other factors that are taken into account, such as, confluence or time frame.
The last circle on the right side of the chart indicates that the price comes back and move through the second fractal. The area below the second fractal represents the resistance section where traders are waiting to place short orders. These order flows of the traders focus on the outer lines of this fractal and the next one that is about to appear.
The next chart shows the price fractals with the bullish trend.
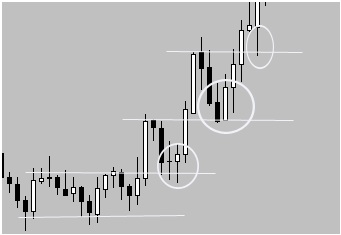
The first circle shows the retracement and a rejection of the price from the upper portion of fractal it breaks out of, and the remaining two circles represent the same retests as the price surges. Each fractal’s bandwidth slowly extends as the upward movement picks up the momentum.
However, you should remember that being a trader, you should always include other patterns and information whenever you use any strategy or take a trading decision.
Register For...
Free Trade Alerts
Education
1-on-1 Support
eToro Copytrader Tips